100% Open Source Infrastructure Monitoring
Yes, it is possible to monitor your infrastructure from OS to application layer using only Open Source Software.
Ingredients
Custom scripts
Plan
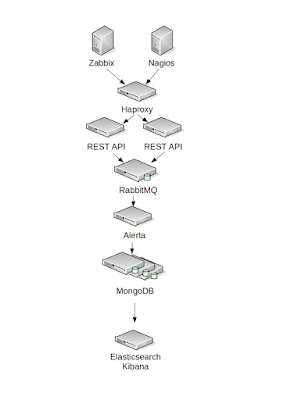
Use Zabbix and Nagios, according to your/your team preference to collect metrics, define thresholds and alarms.
Use Alerta, ran on uWSGI with nginx as a frontend, using MongoDB to visualize alarms in one console, and possibly deduplicate them, in case when one application/server is monitored by more than one tool.
Use Elasticsearch as a alarm history database, and Kibana for dashboards, statistics, and user interface.
Use RabbitMQ and custom scripts to bond everything together.
Use HAProxy to balance the traffic between users and Alerta API server, and between alert sources and RabbitMQ.
Realization
REST API on diagram is a Flask application, responsible for normalizing events, mapping different field names between source fields, and format accepted by Alerta. This part of solution is going to be opensourced, if it will be possible to make it generic enough.
RabbitMQ should be clustered.
Alerta should be run with at least 2-4 instances on single node (easily achievable with emperor mode in uWSGI), with multiple nodes behind HAProxy if you have > 100 active alarms and/or > 10 users.
MongoDB should be deployed at least as a 3 member Replica Set, or a shard, with monitoring.alerts sharded collection - depending on your workload.
There is also a custom script which pulls messages from RabbitMQ queue and POST them to Alerta API, and another one for POST'ing expired alerts to Elasticsearch for archiving purposes.
Performance
Event throughput from source systems (Zabbix, Nagios, requests from scripts, etc) - constant flow of ~ 20/sec with peaks at 100-200/sec
400-1000 active alarms
RabbitMQ -> Alerta API consumer (in fact Alerta API + MongoDB performance) - ~ 50 messages/sec
MongoDB -> Elasticsearch performance - 50-400 alerts/sec
Show me a proprietary system, which can achieve similar numbers :)

Komentarze
Prześlij komentarz